

What Is Data Analytics Automation? How It Works, Benefits, and Use Cases
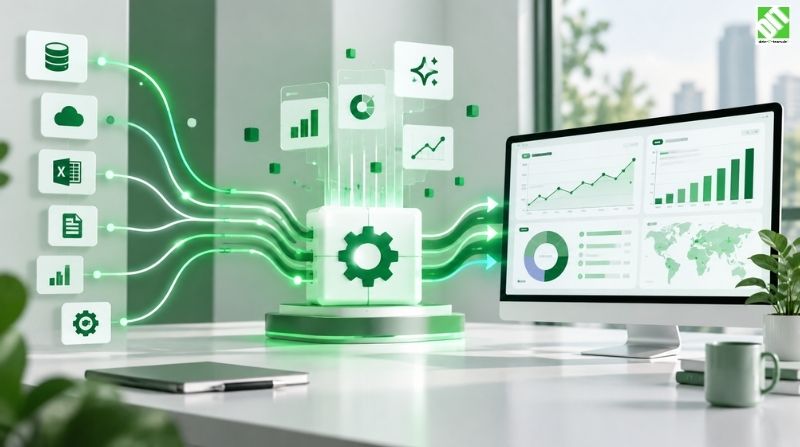
Discover data analytics automation: how it works, key benefits, real-world use cases, implementation challenges, and best practices for ranking.
Data analytics has become the backbone of modern business decision-making. Every organization collects enormous amounts of data from operations, customers, transactions, and digital interactions. Yet most companies struggle with the same problem: they have more data than they can actually process and analyze effectively. Teams spend countless hours extracting data from multiple sources, cleaning it, running reports, and manually creating dashboards. It's repetitive work that demands accuracy but consumes resources that could be spent on strategic insights.
This is where data analytics automation transforms the equation. Instead of human analysts spending days on data preparation and routine reporting, automation handles these tasks instantly and continuously. Data flows from source systems into analytical platforms without human intervention. Cleaning routines eliminate duplicates and standardize formats automatically. Reports generate on schedules. Alerts notify relevant teams when metrics cross important thresholds. Dashboards update in real-time with the latest information.
The impact goes beyond simple time savings. Automated analytics catch trends faster than quarterly reviews ever could. Decision-makers get current information instead of last month's snapshots. Errors from manual data handling become impossible because humans aren't entering numbers into spreadsheets. Organizations that implement data analytics automation discover they can ask more sophisticated questions of their data because analysts finally have time to think strategically instead of just moving data around.
But implementing data analytics automation well requires understanding what it actually encompasses, how different technologies work together, what realistic benefits look like, and what challenges emerge during implementation. This comprehensive guide covers everything you need to know about data analytics automation and how it can transform your organization's approach to data.
What Exactly Is Data Analytics Automation?
Data analytics automation refers to the use of technology to perform repetitive data-related tasks without human intervention. This includes extracting data from source systems, transforming it into usable formats, loading it into analytical platforms, running analyses, generating reports, and delivering insights to decision-makers.
Traditional data analytics workflows rely heavily on manual processes. An analyst might log into three different systems, download data as spreadsheets, spend several hours cleaning and combining the data, create a pivot table or basic visualization, and email the results to stakeholders. If the data was entered incorrectly in one of the source systems, the analyst might catch the error, might not. If the sources changed their data structure, the analyst would need to manually adjust their process.
Data analytics automation eliminates these manual steps through orchestrated workflows. Think of it as building a system that knows exactly which data to extract from which sources, how to clean and validate that data, which calculations to run, and how to present results. The system executes this workflow automatically, repeatedly, consistently, every single time.
This goes far beyond simple data export tools. Modern data analytics automation platforms use extraction logic, transformation rules, validation checks, and intelligence to handle complexity that would require significant human oversight in traditional workflows. When something unexpected happens (missing data, invalid values, system unavailability), the system can handle it according to predefined rules rather than requiring human intervention.
How Data Analytics Automation Actually Works
Understanding the mechanics of data analytics automation helps clarify why it's so powerful and where complexity typically emerges.
The Extraction Phase
Data analytics automation starts by connecting to your data sources. These might be databases, cloud applications, CRM systems, ERP platforms, web APIs, or data warehouses. The automation system uses these connections to pull relevant data on a schedule (every hour, daily, weekly, or triggered by specific events).
Extraction can be simple (pull all new records since last run) or complex (use filtering logic to extract only specific types of transactions, apply date ranges, exclude confidential information). Well-designed extraction processes minimize what they pull to avoid unnecessary data transfer and storage.
The Transformation Step
Raw data rarely goes straight into analysis. Numbers might be in different formats across systems. Dates might be stored as text in one system and timestamps in another. Customer names might be stored as separate first and last name fields in one database but single fields in another. Products might be identified by codes in one system and names in another.
Transformation logic standardizes this data. It converts dates to consistent formats, combines or splits fields as needed, applies business logic (like categorizing transactions or calculating derived values), and maps source data to your target analytical structure. Validation rules run during transformation to catch obvious problems. If dates fall outside acceptable ranges, if required fields are missing, if numerical values exceed thresholds, transformation rules can flag these issues, handle them according to predefined logic, or halt the process if the data is too corrupted to proceed safely.
The Loading Process
Cleaned, validated data loads into your target system. This might be a data warehouse, a business intelligence platform, a data lake, or an analytics database. Loading processes can append new data to existing tables, update existing records, or replace entire datasets depending on your requirements.
Most data analytics automation platforms handle the complexity of loading intelligently. They understand the structure of your target system, manage transactions and rollbacks if something fails midway, and provide logging so you know exactly what loaded and when.
The Analysis and Reporting Phase
Once data lives in your analytical system, automated processes run analyses according to your specifications. These might be simple calculations (total revenue by region, average order value by customer segment) or complex statistical analyses (regression models, forecasting, anomaly detection). Reports generate automatically based on templates. Dashboards update with the latest metrics. Alerts trigger when important thresholds are crossed.
This phase is where the business value emerges. Instead of analysts running the same reports manually every week, those reports exist continuously with fresh data. When a metric deviates from expected patterns, stakeholders know immediately rather than discovering it weeks later.
The Delivery and Action Phase
Automated insights need to reach the people who can act on them. This might mean emailing reports to executives, publishing dashboards to web interfaces, sending alerts through messaging platforms, or automatically triggering downstream actions (like adjusting inventory levels if stock predictions fall below thresholds).
Modern data analytics automation often includes conditional logic. If sales are trending down in a specific region, automatically alert that regional manager. If inventory is predicted to run out within thirty days, trigger a reorder. If customer churn risk scores exceed a threshold, route those customers to retention specialists.
Key Components That Make Data Analytics Automation Work
Several technical and organizational components must work together effectively.
Data Integration and Connectivity
You need reliable connections to all your data sources. This includes database drivers, API clients, cloud connectors, and ETL (Extract, Transform, Load) capabilities. The system must be able to authenticate securely, pull data reliably even if source systems are temporarily unavailable, and handle changes to source systems without breaking the entire pipeline.
Modern data analytics automation platforms typically support dozens of standard integrations (Salesforce, SAP, Oracle, Microsoft dynamics, Google Workspace, AWS, Azure, and many others) plus APIs for custom connections to proprietary systems.
Data Storage and Warehousing
Extracted data needs somewhere to live while it's being transformed and analyzed. This might be a traditional data warehouse, a cloud data platform like Snowflake or BigQuery, a data lake, or a specialized analytical database. The platform you choose affects cost, performance, scalability, and how easily business users can query the data.
Transformation and Preparation Engine
The system that converts raw data into analysis-ready information needs to handle complex business logic, conditional transformations, data validation, and error handling. Some platforms provide visual workflow builders. Others require coding. Most offer both, letting different team members work at the level appropriate to their skills.
Orchestration and Scheduling
Something needs to manage when workflows run, handle dependencies between steps (step B can't start until step A completes), retry failed steps with appropriate backoff, and alert operators if something goes wrong. This orchestration layer determines reliability and prevents cascading failures where one problem breaks downstream processes.
Analytics and Visualization
Once data is clean and accessible, business intelligence tools help people understand it. Dashboards, reports, charts, and interactive visualizations make data accessible to non-technical users. Tools range from basic charting capabilities to sophisticated analytics platforms with advanced statistical analysis, machine learning integration, and natural language query capabilities.
Governance and Monitoring
Who has access to what data? Where did specific data points come from? If a number is wrong, where along the pipeline did the error occur? Governance determines access control, tracks data lineage, enforces data quality standards, and provides audit trails.
Monitoring tracks system health. Is data flowing as expected? Are transformations completing successfully? Are there backlogs? Are query performances acceptable? Good monitoring catches problems before they impact users.
Real Business Benefits of Data Analytics Automation
The theoretical benefits are easy to describe. What actually happens when organizations implement data analytics automation correctly?
Dramatically Faster Insights
Most organizations currently run weekly or monthly reporting cycles. Quarterly reviews with month-old data are standard. Data analytics automation enables real-time or near-real-time insights. You know what happened today, not what happened last month. This speed advantage matters enormously in competitive markets. If you notice trends faster than competitors, you can respond faster.
A retail company using data analytics automation knows hourly sales by location, product category, and customer segment. When sales of a specific category in a specific region start dropping unexpectedly, management knows within hours and can investigate. Without automation, they'd discover the problem during the next weekly review and have lost days of sales to the problem.
Dramatically Improved Data Quality
Manual data handling introduces errors. Analysts typo numbers. Spreadsheets get corrupted during editing. Data gets entered in inconsistent formats. One person uses "CA" for California, another uses "California". Duplicate records proliferate because nobody has a comprehensive view of all customer records.
Automated analytics enforce consistency and catch problems immediately. Invalid data gets flagged before it corrupts your analysis. Duplicates get identified and merged according to rules. Data quality improves markedly simply by removing humans from routine data handling.
Reduced Operational Costs
This is the most easily measured benefit. How many analysts do you employ just to pull data, clean it, and build reports? How much of their time goes to asking for the same reports repeatedly? Data analytics automation handles this work. You might not reduce headcount, but you redeploy analysts to higher-value work like digging into why metrics changed rather than just reporting what changed.
Better Decision-Making
Fresh data leads to better decisions. When you make decisions based on current information rather than last month's snapshot, you make better choices. But beyond speed, automation enables better analysis. Analysts with time to think deeply can ask more sophisticated questions of data. They can build predictive models instead of just reporting historical actuals. They can identify patterns across millions of transactions that would be impossible to spot in manual reports.
Scalability Without Proportional Cost Increase
Adding one hundred thousand more transactions per month to manual reporting processes significantly increases analyst workload. Adding it to automated processes increases cost minimally (slightly more storage, slightly more processing) and happens without any manual effort. Automation scales with your business.
Regulatory Compliance and Audit Capability
Many regulations require maintaining audit trails of data and how it was processed. Automated systems provide complete, verifiable audit trails showing exactly when data was accessed, how it was transformed, and who looked at results. This makes compliance demonstrable rather than dependent on manual documentation.
Proactive Problem Identification
Humans tend to be reactive with data. Something goes wrong, then someone investigates. Automated analytics can be proactive. Set thresholds for acceptable performance and automatically alert when thresholds are crossed. Implement anomaly detection that flags unusual patterns. Predict problems before they affect business (churn predictions, fraud detection, equipment failure forecasting).
Common Use Cases for Data Analytics Automation Across Industries
Different industries benefit from data analytics automation in different ways, but several use cases appear repeatedly.
Financial Performance and Accounting
Consolidating data from multiple business units, preparing financial statements, tracking budgets versus actuals, and preparing tax documentation traditionally requires armies of accountants working with spreadsheets. Data analytics automation handles most of this. Data from different accounting systems consolidates automatically. Budget variance analysis runs automatically. Tax-relevant transactions get categorized and summarized automatically. Accountants shift from data compilation to analysis and interpretation.
Customer Analytics and Behavior Understanding
Understanding customer behavior at scale requires analyzing millions of transactions. Data analytics automation pulls data from transaction systems, CRM systems, website analytics, and marketing platforms. It builds unified customer profiles, tracks customer lifecycle metrics, calculates customer lifetime value, identifies churn risk, and segments customers for targeted marketing. Individual analysts could never perform this analysis manually.
Sales Pipeline and Revenue Forecasting
Sales organizations need to understand pipeline health, forecast revenue, and identify bottlenecks. Automated analytics pulls data from CRM systems, summarizes sales stages, calculates win rates, projects revenue, and flags deals at risk. Sales managers see accurate pipeline visibility without asking analysts for reports. Forecasting improves with consistent, timely data.
Supply Chain and Inventory Optimization
Modern supply chains generate enormous data from warehouses, shipping systems, supplier systems, and demand forecasts. Automated analytics consolidates this data, predicts demand, optimizes inventory levels, and alerts when inventory falls below thresholds or when supply chain disruptions occur. This keeps inventory costs low while preventing stock-outs.
Quality Assurance and Production Efficiency
Manufacturing and service delivery organizations track quality metrics, production volumes, equipment performance, and defect rates. Automated analytics aggregates this data, identifies quality trends before they become serious, tracks efficiency metrics by shift or location, and predicts equipment maintenance needs. Production teams improve quality and efficiency based on data rather than intuition.
Marketing Performance and ROI Tracking
Marketing teams run campaigns across email, social media, web, and paid advertising. Each channel produces data about impressions, clicks, conversions, and cost. Data analytics automation consolidates data from all these sources, calculates ROI by campaign and channel, tracks customer acquisition cost, and helps optimize marketing spend. Instead of marketing teams struggling with spreadsheets, they have integrated dashboards showing performance.
HR and People Analytics
Organizations track employee performance, retention, hiring, compensation, and development. Automated analytics can analyze hiring patterns, predict churn risk, identify high-potential employees, track diversity metrics, and measure training effectiveness. HR teams move from manual reporting to strategic insights about workforce.
Cybersecurity and Risk Management
Security teams need to monitor events across networks, systems, and applications. Automated analytics aggregates security logs, detects anomalous behavior, identifies potential breaches, and tracks security metrics. Without automation, security data volumes make analysis nearly impossible.
Implementing Data Analytics Automation Successfully
Understanding how to approach implementation separates successful deployments from failed attempts.
Start With Clear Business Objectives
Too many data analytics automation projects fail because they lack clear objectives. They become technology projects rather than business transformation projects. Before selecting tools or hiring consultants, define what you're trying to accomplish. Are you trying to reduce reporting time? Improve data quality? Enable faster decision-making? Reduce costs? Scale analysis capability? Be specific about what success looks like.
This clarity guides technology selection, helps you measure success, and prevents scope creep that derails projects.
Identify Your Most Impactful Use Cases
Don't try to automate everything simultaneously. Identify the highest-impact, most-painful manual processes. What reports do people request constantly? What data quality problems cause the biggest problems? What analyses take the most time?
Often, automating just the top three pain points yields 80% of the benefit. You gain success, organizational confidence, and momentum for expanding automation. Projects that try to boil the ocean often get bogged down in complexity.
Assess Your Data Landscape
Successful data analytics automation requires good source data. You can't build accurate analysis on top of poor-quality source data. Before implementing, assess your source systems. Are your databases well-structured? Is your data consistently formatted? How much manual data entry occurs (this data is inherently error-prone)? Is your data scattered across incompatible systems?
Sometimes, data quality improvements in source systems need to happen before analytics automation becomes worthwhile.
Choose the Right Technology Stack
This is where understanding your specific needs matters. Do you need to connect to many different data sources? Does your data need complex transformations? Do you need real-time data or is batch processing acceptable? Do non-technical users need to build their own analyses?
No single platform excels at everything. Platforms strong in data integration might be weaker in analytics. Platforms with powerful transformation capabilities might have limited visualization. Understanding your priorities guides selection.
For many organizations, a combination of tools works better than a single platform. A specialized ETL tool handles data integration and transformation. A data warehouse stores integrated data. A business intelligence platform provides analytics and visualization. This best-of-breed approach typically costs more and requires more integration work but often delivers better results than single-vendor solutions.
Plan for Data Governance
Who owns each dataset? Who can access what data? How do you handle sensitive information (personally identifiable information, financial data, health data)? What data retention policies apply? These governance questions seem like administration until something goes wrong.
Build governance into the system from the start. Data security and compliance become much harder to retrofit than to design in initially.
Invest in Data Quality Early
The common saying "garbage in, garbage out" applies fully to data analytics automation. Automating poor-quality data processes just produces poor-quality results faster. Before automating analytical processes, fix data quality problems in source systems.
This might mean implementing data validation in transactional systems, training employees on data entry standards, consolidating duplicate databases, or standardizing data formats. This work usually takes longer and costs more than people expect, but it's essential.
Build Incrementally
Implement data analytics automation in phases. Get version one working, providing value, building organizational confidence. Then expand to additional use cases. Incremental approach reduces risk, allows you to learn from early implementations, and maintains momentum through demonstrated success.
Invest in Training
People need training on how to use new analytics systems, how to interpret automated reports, what governance policies apply, and when and how to request new analyses. Organizations that skip training often fail to gain expected benefits because users don't know how to access or use the insights produced.
Challenges That Emerge During Data Analytics Automation Implementation
Anticipating challenges prevents them from derailing your project.
Data Quality Issues in Source Systems
Source systems designed for transactions aren't always designed for analysis. Data entered to fill out an order form might be inconsistent with data entered in a different system for the same business concept. Addresses might be inconsistent formats. Names might have suffixes in one field or combined into another field. Duplicate records exist in nearly every system.
These problems don't prevent transactional systems from working. They cause serious problems for analytics. You need to fix these issues in source systems or handle them during transformation, both of which require effort and time.
System Integration Complexity
Connecting to many different systems is technically complex. Each system has different authentication mechanisms, APIs, data structures, and update patterns. Building stable connections requires technical expertise. When systems change (new versions, API updates, authentication changes), your connections might break.
Many organizations underestimate integration complexity and timeline. Allocate extra time here.
Transformation Logic Complexity
Converting raw data from multiple sources into a unified structure for analysis is often more complex than expected. Business rules that seem simple (like determining "customer location") might turn out to be complicated when you discover customers can have multiple addresses, each serving different purposes.
Complex transformation logic needs careful documentation, testing, and ongoing maintenance. Changes to source systems often require transformation logic updates.
Performance and Scalability
Automated analytics processes might run fine with your current data volumes and become problematically slow as volume grows. A transformation that takes thirty minutes with one million records might take hours with one hundred million. Queries that return instantly against small datasets might become slow against big data.
Plan for scalability from the start rather than discovering problems after deployment. Choose technologies that scale with your data growth.
Change Management and User Adoption
The technology works, but users don't use it. This happens when automated reports change the way information was previously available, when people distrust data quality, when users aren't trained on how to use new systems, or when the change threatens existing job functions.
Involve end users in design. Demonstrate early value. Train thoroughly. Address concerns about how roles will change. This people-focused work often determines success more than the technology.
Maintaining and Updating Systems
Data analytics automation isn't set-and-forget. Source systems change. Analytical requirements evolve. Business processes change. If transformation logic isn't updated when source systems change, data quality degrades. If reports don't adapt to new business requirements, they stop delivering value.
Plan for ongoing maintenance and updates. Budget for a person or team to own the system after implementation.
Technology Approaches to Data Analytics Automation
Different architectural approaches work for different situations.
Traditional Data Warehouse Approach
Build a central data warehouse using databases like SQL Server, Oracle, or PostgreSQL. ETL tools (like Informatica, SSIS, or Talend) extract data from source systems, transform it, and load it into the warehouse. Business intelligence tools (like Tableau, Power BI, or Qlik) query the warehouse and present results to users.
This approach works well for organizations with relatively stable data sources and requirements. It provides good control and governance. Trade-offs include higher infrastructure and maintenance costs, less flexibility when source systems change, and longer timeframes to implement new analyses.
Cloud-Native Data Platform Approach
Use cloud services like Snowflake, BigQuery, or Azure Synapse. These platforms provide data storage, transformation capabilities, and sometimes analytics functionality in a managed cloud service. You connect source systems, define transformations, and let the cloud platform handle storage and scaling.
This approach offers flexibility, easier scaling, and lower infrastructure management. Trade-offs include cloud costs that can surprise organizations, potential vendor lock-in, and sometimes less control over data residency and security.
Modern Data Lake Approach
Store raw data in cloud object storage (S3, Azure Blob Storage, GCS) in its original format. Use processing frameworks (Spark, Hadoop, Presto) to query and transform data on demand. This approach handles unstructured data well (images, documents, sensor readings) and offers flexibility.
This approach works well for organizations with diverse data types and evolving analytical needs. Trade-offs include higher complexity, requirement for technical expertise, and potential for cost surprises if not managed carefully.
Composable Analytics Approach
Rather than building one monolithic system, combine best-of-breed tools. A specialized data integration tool handles connectivity. A cloud data warehouse handles storage. An analytics platform handles visualization. API layers enable data flow between components.
This approach offers flexibility and lets teams choose the best tool for each job. Trade-offs include more complex overall architecture, more integration work, and requirement for teams to manage multiple platforms.
Agentic AI and Intelligent Automation Approach
The newest approaches combine artificial intelligence with data analytics automation. Rather than rigid rules defining data transformation and analysis, AI systems learn from historical data and adapt to changes. They identify patterns, optimize workflows, and sometimes make intelligent decisions about data handling.
This approach handles complexity and change better than rigid rule-based systems. Trade-offs include higher complexity, need for training data, and less transparent decision-making (you might not fully understand why the AI chose a particular approach).
Most organizations benefit from hybrid approaches combining elements of multiple architectures.
Cost Factors in Data Analytics Automation
Understanding cost components prevents budget surprises.
Technology Licensing and Infrastructure
You need to pay for the tools themselves (data integration, data warehouse or data platform, analytics visualization). Costs might be per-user, per-data volume, per-processing capacity, or subscription-based depending on the platform.
If you run on cloud platforms, costs scale with usage. During peak periods, costs spike. Many organizations are surprised by cloud bills that grow faster than expected.
For an organization of 100 employees with moderate data volumes, basic data analytics automation might cost $5,000 to $15,000 per month in platform and infrastructure costs. For large enterprises with significant data volumes and requirements, costs easily exceed $50,000 monthly.
Implementation and Integration
Building connections to your data sources, designing and building transformation logic, and configuring analytics require professional services. Small implementations might cost $30,000 to $80,000. Complex enterprise implementations commonly cost $200,000 to $500,000 or more.
This is where scope control matters. Detailed planning and clear requirements help prevent cost overruns.
Internal Resources
Someone needs to own the system after implementation. Data engineers maintain connections and transformation logic. Analytics engineers build reports and dashboards. Data analysts maintain quality and investigate issues. DBAs manage infrastructure. This team might range from 0.5 FTE for small implementations to multiple full-time people for large deployments.
Ongoing Maintenance and Evolution
After initial implementation, continuous investment is required. When source systems change, transformation logic might need updates. When business requirements change, reports and dashboards need updates. New data sources might be added. New analyses requested. This ongoing work consumes resources continuously.
Plan 10-20% of initial implementation cost annually for maintenance and evolution.
Hidden Costs
Data migration costs if you're moving to new platforms. Data quality improvement costs in source systems. Training costs for users. Remediation costs when things go wrong. These hidden costs often equal or exceed planned costs. Budget conservatively and reserve contingency funds.
Best Practices for Successful Data Analytics Automation
Several principles consistently appear in successful implementations.
Align Automation with Business Objectives
Don't automate just for the sake of automating. Focus on automating processes that deliver business value. Automating a report that nobody uses doesn't improve the business.
Start by understanding what decisions people make using analytics, what information they need to make those decisions well, what's currently missing or slow, and where automation would deliver the most value.
Prioritize Data Quality
Garbage in, garbage out. Spending 30% of your budget on data quality improvements in source systems and the remaining 70% on analytics automation delivers better results than spending 10% on quality and 90% on automation tools.
Data quality work is less glamorous than shiny new analytics platforms, but it matters more for success.
Start Small and Expand
Build confidence and organizational support through early wins. Automate the most impactful, most painful process first. Get it working reliably. Demonstrate value. Then expand.
Organizations that try to transform everything simultaneously get bogged down in complexity and often fail.
Invest in People and Training
Technology is necessary but insufficient for success. You need people with the right skills to build and maintain systems. You need users trained on how to interpret and use results. You need organizational change management to help people adapt.
The best technology in the world fails with poor people and change management.
Build Governance into the System
Don't add governance after the fact. Governance determines who can access what data, how data quality is maintained, how changes are managed. Building it in from the start prevents many problems that are otherwise hard to fix.
Monitor and Maintain Continuously
Data analytics automation systems degrade if neglected. Source systems change. Transformation logic becomes outdated. Performance degrades as data volumes grow. Stakeholder requirements evolve.
Build ongoing monitoring and maintenance into your operating model. Dedicate resources to keeping the system healthy and evolving.
How to Evaluate Whether Data Analytics Automation Makes Sense for Your Organization
Not every organization should implement data analytics automation immediately. Several factors should influence the decision.
You're a good candidate for data analytics automation if you handle large data volumes (hundreds of thousands of records or more), if data quality is currently a problem, if analysts spend significant time on data preparation and routine reporting, if you need to make decisions faster than current processes allow, or if you can't scale current processes to handle growing data volumes.
You might want to wait if your data volumes are small, if most of your analytics are one-off analyses rather than recurring reports, if your data quality is already excellent, if you lack internal technical skills to manage systems, or if your business is rapidly changing in ways that would make automation logic quickly obsolete.
An honest assessment of current pain points and future requirements helps guide the decision.
The Role of Artificial Intelligence in Modern Data Analytics Automation
Traditional data analytics automation uses rule-based transformation and predefined analysis logic. You tell the system exactly what to do, and it does it consistently. Artificial intelligence adds adaptive capability. Rather than hard-coding transformation rules, machine learning models learn appropriate transformations from example data. Rather than relying on manual analysis of results, AI systems identify patterns and anomalies automatically.
AI excels at tasks that benefit from learning and pattern recognition. Anomaly detection, demand forecasting, customer segmentation, and churn prediction often perform better with AI than with rule-based approaches. Natural language interfaces let non-technical users query data by asking questions rather than building technical queries.
The trade-off is complexity. AI systems are less transparent than rule-based systems. You might not fully understand why the system made a particular decision. AI systems require training data and ongoing refinement. They're not a substitute for careful design and governance; they're a tool that can enhance automation when applied appropriately.
Moving from Manual Analytics to Automated Analytics
The transition from manual to automated analytics affects organizational structure, skill requirements, and work patterns.
Analysts shift from operational tasks (extracting data, building reports) to strategic tasks (digging into why metrics changed, building predictive models, identifying business opportunities). This transition requires training on new tools and often involves skill development in advanced analytics.
Departments get better information faster. They become more data-driven because information is constantly available rather than waiting for quarterly reports. This requires a cultural shift toward trusting data in decision-making.
IT infrastructure requirements change. You need data warehousing, analytics platforms, and integration capabilities that many organizations lack. Building this infrastructure takes time and investment.
Successful transitions manage both the technology change and the organizational change. It's not just about implementing tools. It's about changing how the organization uses data.
Real-World Example: How Data Analytics Automation Transforms Operations
Consider a mid-sized retail company with 50 stores. Currently, store managers manually count inventory several times per month, send results in spreadsheets to headquarters, analysts spend a week compiling this data, and then headquarters has a month-old view of inventory.
With data analytics automation, point-of-sale systems automatically transmit sales data hourly. Inventory tracking systems automatically report stock levels. A data platform consolidates this data and updates inventory dashboards in real-time. Analytics automatically flag stores where inventory is below safety stock levels and predict when reorders are needed.
The outcomes are significant. Inventory carrying costs drop because stores order based on data rather than guesses. Stock-out situations that previously happened weekly become rare because algorithms predict needs accurately. Store managers see real-time inventory data and can make decisions immediately rather than waiting for reports. Analysts shift from data compilation to analyzing why specific stores have different inventory patterns and identifying optimization opportunities.
The implementation took four months, cost $120,000 including technology and professional services, and has already paid for itself through inventory savings in the first year. Future years show pure benefit.
Integration With Your Existing Systems
Most organizations can't replace everything immediately. Data analytics automation needs to work alongside existing systems. Your ERP system stays. Your CRM stays. Your accounting system stays. Data analytics automation connects to them, pulls data, and enriches analytical capabilities.
This integration complexity shouldn't be underestimated. Each system has different APIs, authentication mechanisms, and data structures. Working with experienced robotic process automation partners who understand system integration can accelerate this process significantly. Partners who've integrated similar systems before know common pitfalls and can guide implementation more efficiently than teams starting from scratch.
Measuring Success After Data Analytics Automation Implementation
Define success metrics before implementation so you can measure impact objectively.
Useful metrics include the percentage of analytical work that's automated (if 70% of reports now run automatically, that's significant), time saved by analysts (hours per week previously spent on data preparation), speed of analysis (time from data availability to insight available), improvement in data quality (reduction in data issues discovered), cost savings (operational costs before and after), and improvement in decision speed (how much faster decisions are made).
Not all metrics are equally important. For some organizations, the speed of decision-making matters most. For others, cost reduction is primary. For others, the ability to scale analytics to more users matters most.
Measure what matters to your organization and track regularly to demonstrate ongoing value and identify areas needing improvement.
Future of Data Analytics Automation
The field continues evolving rapidly.
Increasing AI Integration
More automation will incorporate AI and machine learning. Rather than rule-based transformations, systems will learn appropriate transformations from data. Rather than predefined reports, systems will identify insights automatically. Natural language interfaces will let non-technical users interact with data.
Faster Decision-Making Cycles
Real-time analytics are becoming mainstream. Organizations will make decisions based on current information rather than historical snapshots. This speed advantage will drive competitive advantage in many industries.
Broader Accessibility
Currently, data analytics requires technical expertise. Future systems will make analytics accessible to non-technical business users through natural language, visual interfaces, and guided analysis. More people across organizations will be able to analyze data and find insights.
Automated Insights
Rather than humans finding insights in data, AI systems will identify patterns, flag anomalies, identify opportunities, and recommend actions. Humans will validate and act on these AI-identified insights rather than discovering them manually.
Better Data Integration
Connecting data from diverse sources will become easier. Rather than custom integration for each data source, growing ecosystem of pre-built connectors will make integration faster and cheaper.
Enhanced Privacy and Security
As data analytics grow more powerful, privacy and security become more important. Future systems will make it easier to apply privacy controls, encrypt data, track data lineage, and maintain compliance with evolving regulations.
When Should You Partner With External Experts for Data Analytics Automation?
Building data analytics automation in-house is possible, but external partners offer significant value in certain situations.
You should consider working with experienced partners if you lack internal technical expertise (data engineers, analytics engineers, database administrators), if you need to accelerate implementation timeline, if you're implementing complex systems across many data sources, if you're uncertain about technology selection, or if you want to avoid costly mistakes that less experienced teams commonly make.
Partners who specialize in data analytics automation bring expertise from working on similar projects at other organizations. They know what works, what doesn't, and what common pitfalls to avoid. They have tools, templates, and processes that accelerate implementation. The investment in external expertise often pays for itself through faster implementation, fewer mistakes, and better initial system design.
Partners experienced in custom software development and data platform architecture can architect solutions specifically designed for your organization's needs rather than forcing you into generic tools.
Conclusion: Why Data Analytics Automation Matters for Modern Businesses
Data drives modern business decisions. Yet most organizations struggle to get the data they need in time to make decisions effectively. Teams spend hours on data preparation instead of analysis. Reporting cycles measure months instead of hours. Data quality problems undermine confidence in insights.
Data analytics automation solves these problems directly. It handles repetitive data work automatically, continuously, consistently, reliably. It surfaces insights faster. It improves data quality. It scales analysis capability. It frees analysts to work on higher-value strategic analysis.
The implementation requires investment in technology, expertise, and organizational change. But the return on that investment through faster decisions, improved data quality, reduced costs, and better business outcomes typically exceeds expectations.
If your organization struggles with data challenges, if analysts spend too much time on routine reporting, if decision-making is slowed by slow data availability, or if you're facing growing data volumes that current processes can't scale to handle, data analytics automation should be seriously considered.
The future belongs to organizations that can analyze data faster than competitors. Data analytics automation is the technology that enables that speed advantage. Starting the journey now positions your organization to compete more effectively as data-driven decision-making becomes increasingly important.
If you're interested in exploring what data analytics automation could look like for your specific situation, understanding the related topic of data entry automation provides helpful context on how process automation complements analytics automation. Both together create powerful capability for data-driven operations.
Frequently Asked Questions About Data Analytics Automation
What's the difference between data analytics automation and business intelligence?
Business intelligence refers to tools and processes for turning data into insights. Data analytics automation refers to automating the data workflows that business intelligence depends on. BI is about analysis and visualization. Data analytics automation is about getting clean, integrated data to those BI tools reliably and continuously. They're complementary. BI without good data is limited. Automated data pipelines without BI tools don't reach their potential.
How long does data analytics automation implementation typically take?
Timeline depends heavily on complexity. Simple implementations automating one or two existing reports might take two to three months. Moderate implementations consolidating data from three to five systems might take four to six months. Complex enterprise implementations with many systems, complex transformations, and high data volumes often take nine to twelve months. Start with smaller implementations to build momentum.
What data sources can be integrated into data analytics automation?
Most modern data systems can be integrated. Databases like SQL Server, Oracle, PostgreSQL. Cloud applications like Salesforce, Google Workspace, Microsoft 365. ERP and CRM systems like SAP, Oracle, Microsoft Dynamics. Specialized systems like Shopify, Stripe, banking systems. IoT devices, web APIs, and log files. The number of available pre-built connectors has grown significantly, making integration easier than it once was.
Does data analytics automation require cloud technology or can it work on-premises?
Both work. Some organizations prefer on-premises infrastructure for data residency or control reasons. Others prefer cloud platforms for scalability and lower infrastructure management. Hybrid approaches combining on-premises and cloud are increasingly common. Technology selection should be based on your requirements, not a requirement to go cloud-first.
What skills do you need in-house to manage data analytics automation systems?
Ideally, you need data engineers to build and maintain data pipelines, analytics engineers or BI specialists to build reports and dashboards, database administrators to manage data platforms, and data analysts to leverage the systems for business insights. Not every organization has all these skills initially. This can be addressed through hiring, training, or partnerships with external providers.
How do you ensure data security and privacy in automated systems?
Security and privacy should be designed into the system from the start. This includes authentication and authorization controls (who can access what data), encryption in transit and at rest, audit logging to track who accessed what data when, data retention policies to delete data when no longer needed, and compliance with relevant regulations (GDPR, CCPA, industry-specific rules, etc.). Working with security-conscious partners helps ensure these aren't forgotten.
Can data analytics automation handle unstructured data like documents and images?
Yes, with appropriate tools. Modern data lakes handle unstructured data well. Machine learning can extract information from documents and images. Audio and video can be transcribed. The transformation and analysis becomes more complex than with structured data, but definitely possible.
What happens when source systems change or new sources need to be added?
Well-designed systems accommodate change. If transformation logic is well-documented and modular, changes to source systems can be incorporated relatively easily. Adding new data sources requires building new connections and potentially adjusting transformation logic, but established processes can handle this. This is why ongoing maintenance is necessary.
How do you handle real-time vs batch processing in data analytics automation?
Both have merit. Batch processing (running transformations on schedules, like nightly) is simpler and cheaper but provides less current data. Real-time or near-real-time processing provides fresher data but is more complex and expensive. Most organizations use hybrid approaches, running some transformations in real-time for critical metrics and batch processing for others.
What's the difference between data analytics automation and traditional ETL tools?
Traditional ETL (Extract, Transform, Load) tools focus on moving data from source systems to data warehouses. Data analytics automation is broader, including data pipeline, data quality, analytics execution, and insight delivery. Modern data analytics automation platforms often include ETL capabilities plus additional functionality. The terms overlap increasingly as the market evolves.
How do you measure ROI on data analytics automation investment?
Key metrics include cost savings from automating manual processes, time savings for analysts, improvement in decision-making speed, improvement in data quality, and improvement in business outcomes (better revenue, lower costs, improved customer satisfaction, etc.). Not all benefits are immediately quantifiable, but focusing on measurable metrics helps justify ongoing investment and identify where additional improvements would be valuable.
Recent Posts
September 14, 2026
September 10, 2026